February 25, 2026 a 08:00 am

EA: Fundamental Ratio Analysis - Electronic Arts Inc.
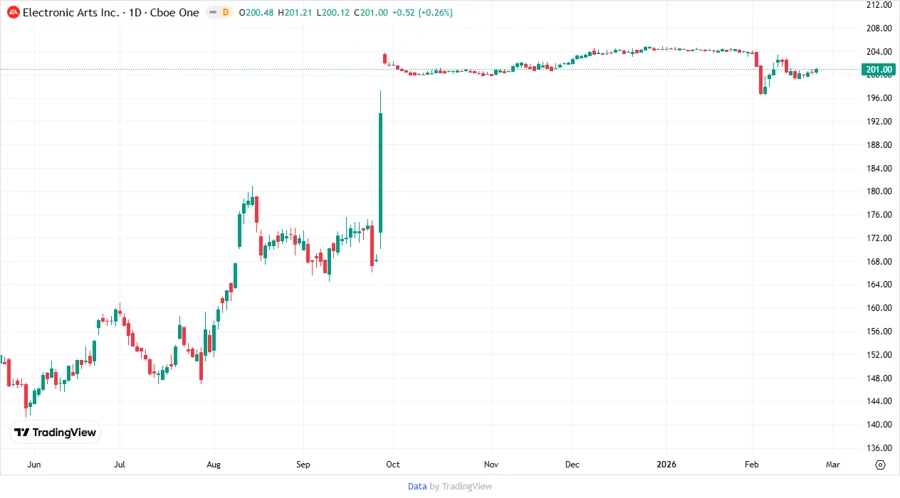
Electronic Arts Inc. stands as a strong player in the gaming industry, recognized for its diverse content and widespread reach across various platforms. With multiple successful franchises, the company continues to lead in innovation and market presence. However, investment risks remain due to market competition and evolving consumer preferences.
Fundamental Rating
The fundamentals of Electronic Arts show a balanced performance, with strengths in cash flow and equity returns.
| Category | Score | Visualization |
|---|---|---|
| Discounted Cash Flow | 4 | |
| Return on Equity | 4 | |
| Return on Assets | 4 | |
| Debt to Equity | 2 | |
| Price to Earnings | 1 | |
| Price to Book | 1 |
Historical Rating
The historical ratings of Electronic Arts remain fairly consistent, reflecting stability in financial metrics.
| Date | Overall | DCF | ROE | ROA | Debt/Equity | P/E | P/B |
|---|---|---|---|---|---|---|---|
| 2026-02-25 | 3 | 4 | 4 | 4 | 2 | 1 | 1 |
| 2026-02-24 | 3 | 4 | 4 | 4 | 2 | 1 | 1 |
Analyst Price Targets
Analyst projections suggest a moderate growth expectation with a consensus leaning towards 'Hold'.
| High | Low | Median | Consensus |
|---|---|---|---|
| $210 | $191 | $210 | $206.78 |
Analyst Sentiment
The analyst sentiment reflects a strong divide, with a majority indicating a 'Hold' position.
| Recommendation | Number | Distribution |
|---|---|---|
| Strong Buy | 0 | |
| Buy | 30 | |
| Hold | 36 | |
| Sell | 0 | |
| Strong Sell | 0 |
Conclusion
Electronic Arts Inc. showcases a stable financial outlook with key strengths in its return on equity and cash flow. Despite a challenging competitive landscape, the company is poised to maintain its market edge through innovation and strong brand franchises. Investors may benefit from potential stock appreciation, though the 'Hold' sentiment advises caution. Continued monitoring of market trends and technological advancements will be essential. The balance of opportunity and caution defines the current investment perspective for EA.
This structured HTML snippet offers a comprehensive analysis of Electronic Arts Inc. optimized for mobile integration into an existing website lacking style elements beyond necessary visual indicators.
Smart Data Insight
Master the Perfect Entry & Exit for this Stock
Don't leave your profits to chance. Historically, this stock follows specific seasonal patterns that institutional traders use to maximize returns.
- ✅ Identify the "Golden Buying Window"
- ✅ Avoid high-risk correction cycles
- ✅ Backtested data from the last 20+ years