December 07, 2025 a 05:15 am

BLK: Fibonacci Analysis - BlackRock, Inc.
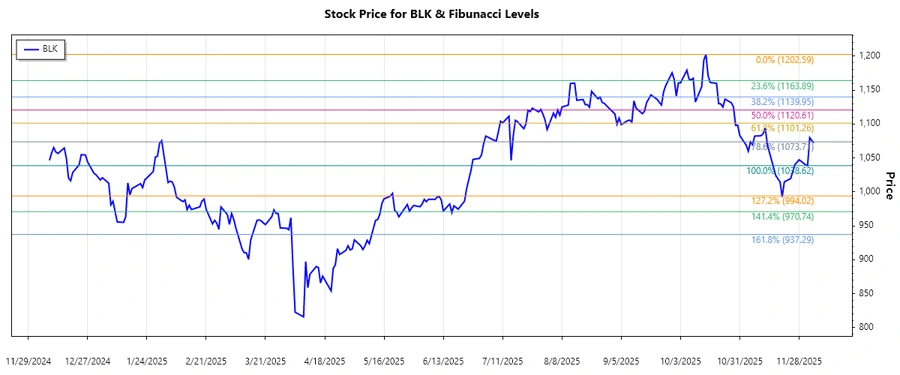
The recent analysis of BlackRock, Inc. (BLK) indicates a significant downtrend over the past months. From a high in mid-October of 2025, the stock has steadily decreased. This declining trend suggests investors are cautious, perhaps due to global economic factors affecting investment managers. Understanding the potential support levels using Fibonacci retracement can help strategize possible price stabilizations or further declines.
Fibonacci Analysis
| Trend Details | |
|---|---|
| Start Date | 2025-10-15 |
| End Date | 2025-12-05 |
| High Point | $1202.59 on 2025-10-15 |
| Low Point | $1038.62 on 2025-12-02 |
| Fibonacci Level | Price Level |
|---|---|
| 0.236 | $1162.33 |
| 0.382 | $1146.50 |
| 0.5 | $1126.11 |
| 0.618 | $1099.86 |
| 0.786 | $1062.98 |
Currently, the price seems to be retracing around the 0.786 level, indicating potential support in this region. Technically, this could be viewed as a strong support zone if the price consolidates here before any potential upward movement.
Conclusion
Investors should carefully watch for consolidation around the Fibonacci 0.786 level as it may indicate a potential stabilization in the downward trend. However, if this level fails to hold, it may signify further bearish momentum. Risk-averse investors might consider waiting for more substantial evidence of support or a reversal before making new commitments. Analysts will pay close attention to macroeconomic indicators that could impact investment managers like BlackRock, considering their broad market exposures.