March 06, 2026 a 01:01 pm

ARE: Fundamental Ratio Analysis - Alexandria Real Estate Equities, Inc.
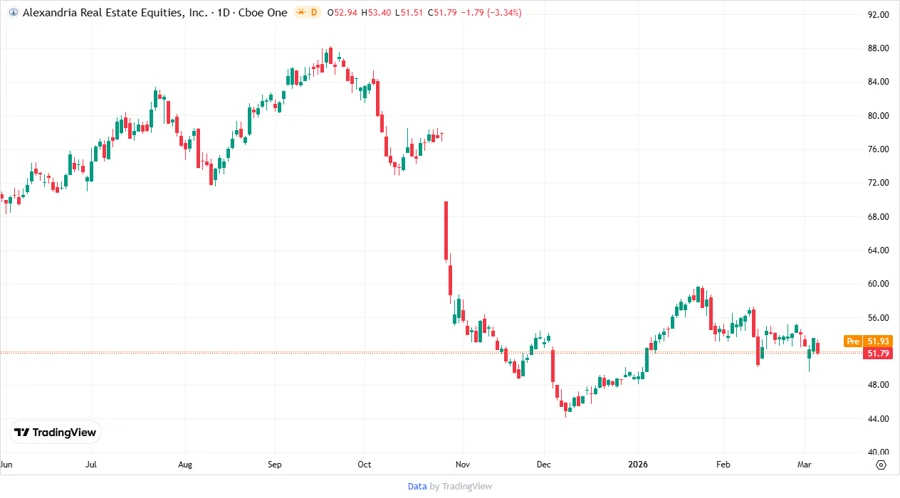
Alexandria Real Estate Equities, Inc. (NYSE: ARE) is a pioneering entity in the urban office REIT space, with a unique focus on life science, technology, and agtech campuses. Despite industry challenges, ARE's strategic positioning in innovation clusters ensures resilient operational performance.
Fundamentals Rating
The fundamental analysis shows solid financial health for ARE, though some key ratios require attention for potential investors.
| Category | Score | Visualization |
|---|---|---|
| Overall | 2 | |
| Discounted Cash Flow | 4 | |
| Return On Equity | 1 | |
| Return On Assets | 1 | |
| Debt To Equity | 3 | |
| Price To Earnings | 1 | |
| Price To Book | 4 |
Historical Rating
Historical data indicates a consistent overall score, suggesting stability in the company's financial framework.
| Date | Overall | DCF | ROE | ROA | D/E | P/E | P/B |
|---|---|---|---|---|---|---|---|
| 2026-03-05 | 2 | 4 | 1 | 1 | 3 | 1 | 4 |
| Previous | 0 | 4 | 1 | 1 | 3 | 1 | 4 |
Analyst Price Targets
Analysts provide varying price targets but suggest a moderate growth outlook based on the median range.
| High | Low | Median | Consensus |
|---|---|---|---|
| 82 | 45 | 60 | 58.33 |
Analyst Sentiment
The consensus suggests a "Hold" status, highlighting cautious optimism among analysts.
| Recommendation | Count | Distribution |
|---|---|---|
| Strong Buy | 0 | |
| Buy | 11 | |
| Hold | 13 | |
| Sell | 0 | |
| Strong Sell | 0 |
Conclusion
Alexandria Real Estate Equities, Inc. remains a significant player within the REIT sector, backed by its strategic focus on innovation-driven campuses. While the firm enjoys a stable financial model, current valuations indicate specific challenges, particularly concerning profitability ratios. Analysts' pricing outlook shows moderate potential with a consensus to hold. Thus, prospective investors should weigh potential growth against inherent risks in the current financial metrics.
This HTML code provides a detailed analysis of Alexandria Real Estate Equities, Inc., encompassing various essential elements such as fundamental ratings, historical performance, analyst price targets, sentiment, and a concluding summary.
Smart Data Insight
Master the Perfect Entry & Exit for this Stock
Don't leave your profits to chance. Historically, this stock follows specific seasonal patterns that institutional traders use to maximize returns.
- ✅ Identify the "Golden Buying Window"
- ✅ Avoid high-risk correction cycles
- ✅ Backtested data from the last 20+ years