May 24, 2026 a 01:15 pm

APH: Trend and Support & Resistance Analysis - Amphenol Corporation
Amphenol Corporation has demonstrated significant movement over the recent months. With operations across harsh environment solutions, communications solutions, and interconnect and sensor systems, the company showcases versatility in product offerings. The current analysis highlights the trend dynamics and key support and resistance zones based on recent price data. Investors might find potential opportunities in identifying critical levels as stock prices tend to react at these points.
Trend Analysis
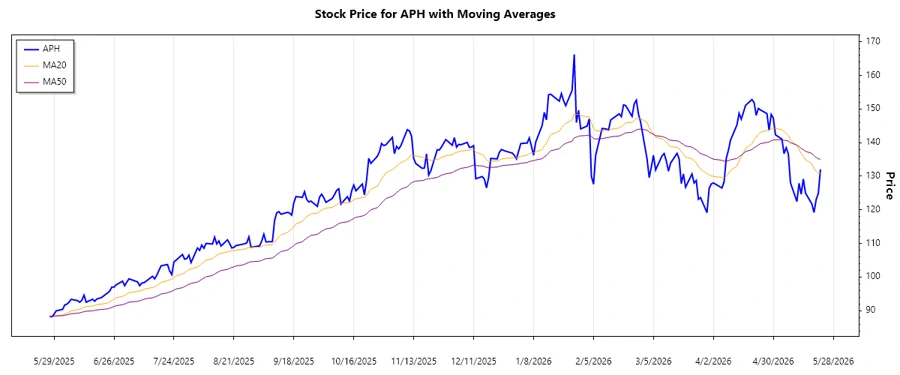
Based on the recent data for Amphenol Corporation, we observe significant price fluctuations over the past months. This analysis focuses on the 20-day and 50-day Exponential Moving Averages (EMAs) to identify the prevailing trend.
| Date | Closing Price | Trend |
|---|---|---|
| 2026-05-22 | 132.06 | ▲ |
| 2026-05-21 | 124.86 | ▲ |
| 2026-05-20 | 123.05 | ▲ |
| 2026-05-19 | 119.20 | ▲ |
| 2026-05-18 | 121.72 | ▲ |
| 2026-05-15 | 125.00 | ▲ |
| 2026-05-14 | 129.19 | ▲ |
The stock is demonstrating an upward trend, as indicated by the 20-day EMA staying above the 50-day EMA. This pattern suggests bullish sentiment among investors.
Support and Resistance
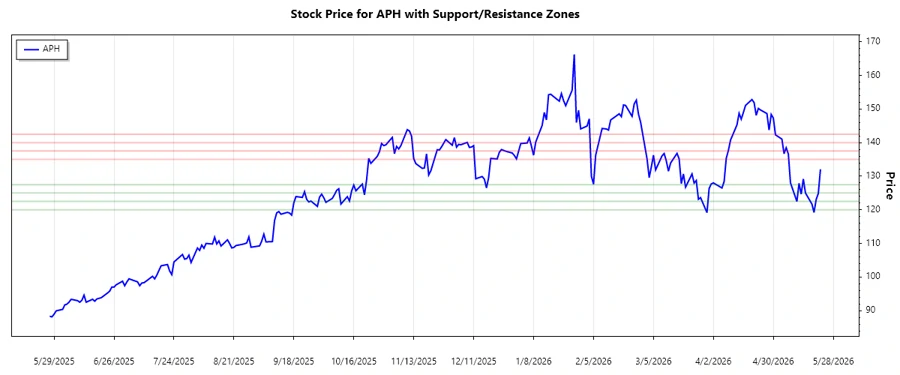
Analyzing historical price levels, we've determined important support and resistance zones critical for APH traders.
| Zone Type | From | To |
|---|---|---|
| Support Zone 1 | 120.00 | 122.50 |
| Support Zone 2 | 125.00 | 127.50 |
| Resistance Zone 1 | 135.00 | 137.50 |
| Resistance Zone 2 | 140.00 | 142.50 |
Currently, the stock price is trading near its established support zone, providing a potential buy opportunity for investors. Historically, prices have shown a tendency to bounce back from this level.
Conclusion
Amphenol Corporation's stock price movement suggests an encouraging upward trend backed by established support zones. The presence of strong support levels may indicate limited downside risk, while the resistance levels mark potential profit-taking points. However, investors should remain cautious of macroeconomic factors that might influence market dynamics. Overall, APH remains an interesting prospect given its technical positioning.
Smart Data Insight
Master the Perfect Entry & Exit for this Stock
Don't leave your profits to chance. Historically, this stock follows specific seasonal patterns that institutional traders use to maximize returns.
- ✅ Identify the "Golden Buying Window"
- ✅ Avoid high-risk correction cycles
- ✅ Backtested data from the last 20+ years